Holyrood 2026 in numbers: a record pro-independence majority of seats on 41% of the list vote
When the SNP opened its "Choose Scotland" campaign in October 2026, John Swinney told the party that "we have the biggest, pro-independence majority in the history of the Parliament". On seats, the claim is right. On votes, the May 2026 election tells a different story. We put the official figures for every Holyrood election since 2007 side by side to show both.
- 73 of 129seats won by the SNP and the Greens in 2026, the highest total so far
- 41.2%their combined share of the regional list vote, down from 48.5% in 2021
- 40.5%their combined share of the constituency vote, down from 49.0%
- 53.2%turnout, against 63.5% in 2021
What happened on 7 May 2026
The results are not in dispute. The BBC's final scoreboard gives the SNP 58 seats (57 constituencies and one list seat), Labour and Reform UK 17 each, the Scottish Greens 15, the Conservatives 12 and the Liberal Democrats 10. As the BBC's report of 9 May put it, the SNP "won a fifth successive Scottish Parliament election, but fallen short of its target of an overall majority", which requires 65 seats. The same report notes that "there is a majority of MSPs at Holyrood who support Scottish independence", the SNP and the Greens together holding 73 of the 129 seats.
The Scottish Parliament's own research service, SPICe, reached the same count in its post-election briefing, adding that 64 of the 129 members were new and that constituency turnout fell to 53.2%, close to the 54.9% average of all Holyrood elections and far below the 84.6% of the 2014 referendum. The parliament later re-elected John Swinney as First Minister at the head of a minority government.
Seats and votes since 2007
The table adds up the two parties that won pro-independence seats, the SNP and the Scottish Greens, for each election since the SNP first came to power. "Seat share" is the share of the 129 seats; the two vote shares are the parties' combined percentages on each ballot.
| Election | SNP seats | Green seats | Together | Seat share | Constituency vote | List vote |
|---|---|---|---|---|---|---|
| 2007 | 47 | 2 | 49 | 38.0% | 33.1% | 35.1% |
| 2011 | 69 | 2 | 71 | 55.0% | 45.4% | 48.4% |
| 2016 | 63 | 6 | 69 | 53.5% | 47.1% | 48.3% |
| 2021 | 64 | 8 | 72 | 55.8% | 49.0% | 48.5% |
| 2026 | 58 | 15 | 73 | 56.6% | 40.5% | 41.2% |
Download the data (CSV, vote counts included)
Three things the figures show
The seat record is real, but narrow. 73 seats beat the 72 of 2021 and the 71 of 2011, when the SNP won its only outright majority. The make-up has changed, though: the Greens more than doubled their seats, from 8 to 15, while the SNP lost six. The pro-independence bloc in the seventh parliament leans more on a second party than any of its predecessors.
The vote fell sharply. On the list ballot, which decides the overall balance of the parliament, the two parties together took 947,913 votes in 2026 against 1,314,698 in 2021, a fall of more than 366,000. Their share dropped from 48.5% to 41.2%, the lowest since 2007. Smaller pro-independence lists that won no seats do not change the picture: the Alliance to Liberate Scotland list took 0.8% on the BBC's figures, against 1.7% for Alba alone in 2021.
The gap between seats and votes has never been wider. If 129 seats were shared in strict proportion to the national list vote, 41.2% would be worth about 53 seats. The SNP and the Greens won 73, some 20 more. In 2011, 2016 and 2021 the bonus was between seven and ten seats.
Why 41% of the vote produced 57% of the seats
Holyrood uses the additional member system: 73 MSPs are elected in constituencies by first past the post, and 56 from eight regional lists that are meant to correct the result. The correction only works up to a point. In each region, list seats are shared out after taking the constituency seats into account, so a party that wins more constituencies than its list vote would justify keeps them; there is no levelling-up for the others.
That is what happened in 2026. The SNP won 57 of the 73 constituencies with 38.2% of the constituency vote, because the vote against it was split four ways. The BBC's results report put it plainly: "Reform's success, fracturing the unionist vote, helped the SNP return a swathe of constituency seats despite their share of the vote declining since 2021." Labour, Reform, the Conservatives and the Liberal Democrats together won 58.2% of the constituency vote and 53.8% of the list vote, but only 56 seats. The SNP's share of the list fell to 27.2%, which brought it a single list seat; the Greens, with 14.0% of the list and two constituency wins, took most of the corrective seats on the pro-independence side.
None of this is unusual for a mixed system. The 2014 referendum, by contrast, was a single national count where every vote weighed the same; our council-by-council results show how 44.7% Yes was distributed across Scotland. Parliamentary arithmetic and referendum arithmetic answer different questions.
Mandate, polls and the "Choose Scotland" campaign
The distinction matters because both sides use these numbers. The SNP had said before the vote that an outright SNP majority could open the way to a new referendum; it did not get one, and now points to the combined pro-independence majority instead. Its "Choose Scotland" campaign, launched at the October conference in Aberdeen, is a £100,000 effort that, according to the PA report carried by the Irish News, runs until Christmas with a national day of action on St Andrew's Day, 30 November. Read the other way, the same results show that most voters backed parties opposed to independence on both ballots.
Opinion polls on the referendum question, a separate measure, have stayed close. YouGov's October 2026 snapshot found 47% Yes and 53% No once undecided voters were excluded, a gap within the margin of error. The running list of independence polls shows results since the election ranging from 40% to 49% Yes with don't-knows included, depending on the pollster and the wording.
The legal position has not moved. Since the Supreme Court's 2022 ruling, Holyrood cannot hold a referendum on its own authority, so any new vote would need the agreement of Westminster, as before the 2014 vote, which rested on a Section 30 order made in 2013. The long dispute over Holyrood's consent to Westminster legislation, which we covered in our article on the 2018 legislative consent row, shows how far apart the two parliaments' readings of a "mandate" can be. For the reforms that followed the No vote, see the road after 2014.
Method, sources and licence
Data. Seats and votes for 2026 come from the BBC's final results page for the Scottish Parliament election 2026, cross-checked with the SPICe briefing of 9 May 2026. Votes and seats for 2007, 2011, 2016 and 2021, and the full 2026 vote counts used in the CSV, come from the results tables of the Wikipedia articles on each election (revisions 1385747069, 1385747234, 1385747249, 1379736624 and 1385747277, read on 21 November 2026), which reproduce the declarations of the returning officers. The SNP and Green shares for 2026 are identical in both sources. The 2026 turnout (53.2%) is the constituency figure given by the BBC and SPICe.
Calculations. "Together" adds SNP and Scottish Green seats; vote shares add their votes on each ballot and divide by all valid votes for that ballot. The "proportional" figure (129 × list share) is a simple benchmark, not a simulation: real allocation works region by region with the d'Hondt divisor and depends on constituency results. The Presiding Officer is counted with the party for which they were elected. Smaller pro-independence parties that won no seats are not included in the totals.
Licence. Our table, chart and CSV file are free to reuse with a link to this page, under CC BY-SA 4.0 (the Wikipedia tables they draw on use the same licence). Published 21 November 2026 by The Union Question.
 Explainers
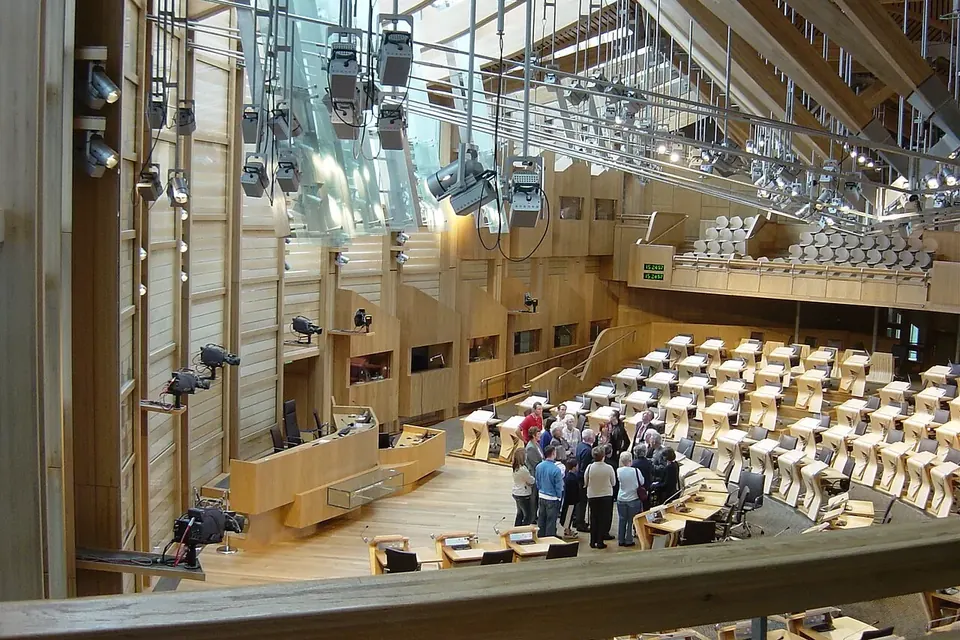
Holyrood's refusal of consent
A 93–30 refusal, the Sewel convention, a walkout at PMQs and the Continuity Bill ruling.
 Background
After the 2014 No vote
The Vow, the Smith Commission, EVEL and the SNP landslide of 2015, in order.
 Events in context
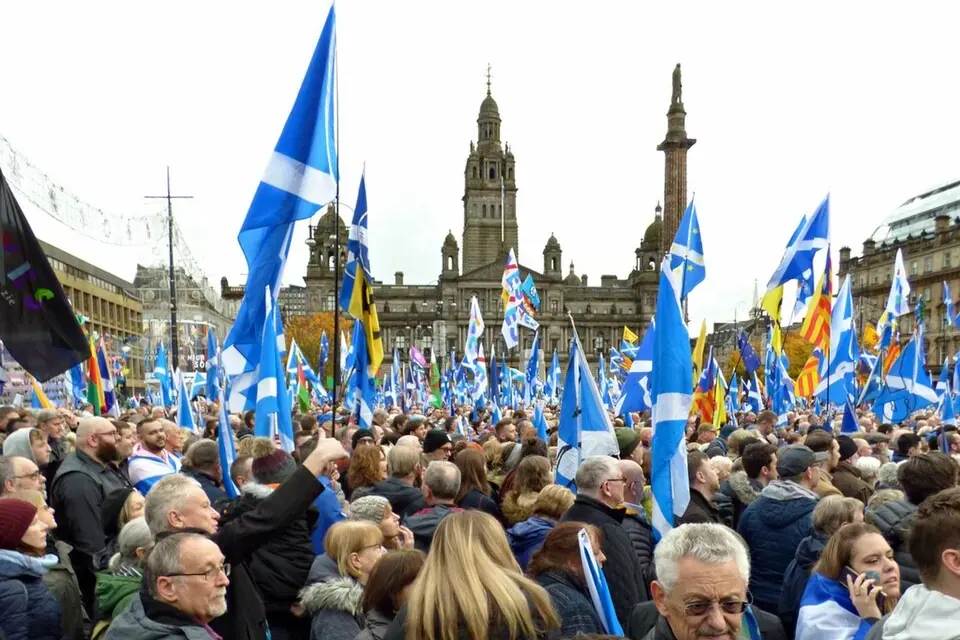
Hope over Fear, 2017
George Square, the 2014 anniversary and the 'power grab' argument over the EU Withdrawal Bill.