Scotland's two referendums, council by council: 2014 and 2016 results compared
Scotland voted twice in less than two years on its place in a union: No to independence in September 2014, Remain in the European Union in June 2016. Both votes were counted in the same 32 council areas. This page sets the two results side by side, so you can see where they line up and where they do not.
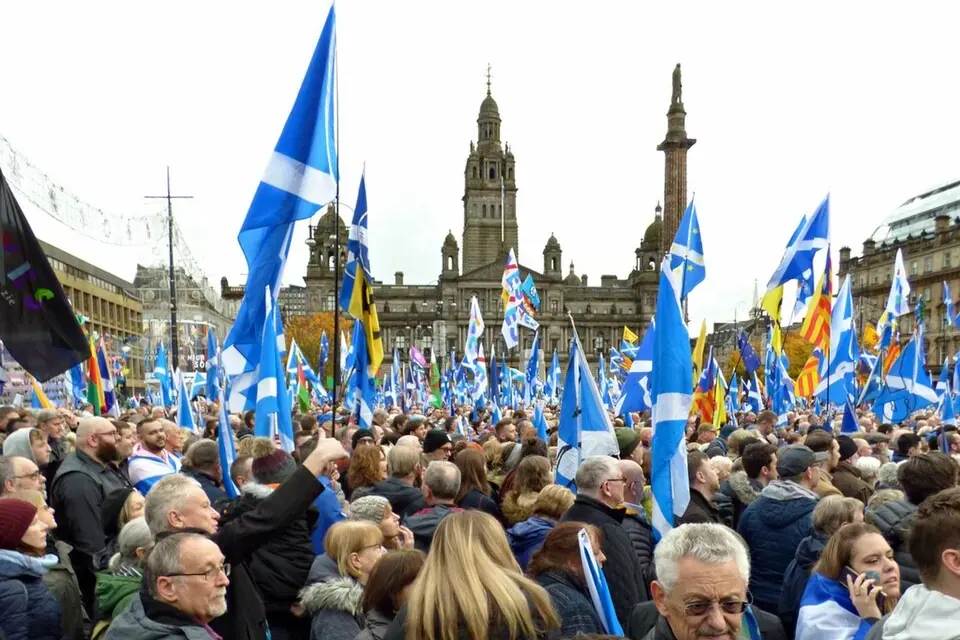
In 2014, 44.7% of valid votes were for independence; only 4 areas, Dundee City, Glasgow City, North Lanarkshire and West Dunbartonshire, returned Yes majorities. In 2016, 62.0% of Scottish votes were for Remain and every council area voted Remain, from 50.1% in Moray to 74.4% in City of Edinburgh. The two maps are different: some of the strongest No areas of 2014, such as East Renfrewshire and Edinburgh, were among the strongest for Remain. That gap is what speakers at the 2017 rallies called a "tale of two referendums".
- 44.7%Yes, 2014
- 84.6%turnout, 2014
- 62.0%Remain, 2016
- 67.2%turnout, 2016
- 4 of 32areas voted Yes
- 32 of 32areas voted Remain
Look up a council area
Pick an area to see its two results, its rank among the 32 and the gap between its Remain and Yes shares. It is also highlighted in the chart and the table.
The two votes on one chart
There is no straight line from one vote to the other. Glasgow, Dundee, North Lanarkshire and West Dunbartonshire, the four Yes areas, sit in the middle of the Remain range. The highest Remain shares came from Edinburgh, East Renfrewshire and East Dunbartonshire, which voted No in 2014 by wide margins. Moray, where the Remain majority was narrowest (50.1%), voted No by 58% in 2014; Dumfries and Galloway, one of the strongest No areas, had the second-lowest Remain share.
All 32 areas
Shares are of valid votes, computed from the vote counts; turnout is as published. Use the column buttons to sort, for example by the gap between the two votes.
| Aberdeen City | 41.4 | 81.7 | 61.1 | 67.9 | +19.7 |
|---|---|---|---|---|---|
| Aberdeenshire | 39.6 | 87.2 | 55.0 | 70.6 | +15.4 |
| Angus | 43.7 | 85.7 | 55.3 | 68.0 | +11.6 |
| Argyll and Bute | 41.5 | 88.2 | 60.6 | 73.1 | +19.1 |
| City of Edinburgh | 38.9 | 84.4 | 74.4 | 72.9 | +35.5 |
| Clackmannanshire | 46.2 | 88.6 | 57.8 | 67.2 | +11.6 |
| Dumfries and Galloway | 34.3 | 87.5 | 53.1 | 71.4 | +18.7 |
| Dundee City | 57.3 | 78.8 | 59.8 | 62.9 | +2.4 |
| East Ayrshire | 47.2 | 84.5 | 58.6 | 62.9 | +11.4 |
| East Dunbartonshire | 38.8 | 91.0 | 71.4 | 75.1 | +32.6 |
| East Lothian | 38.3 | 87.6 | 64.6 | 71.7 | +26.3 |
| East Renfrewshire | 36.8 | 90.4 | 74.3 | 76.1 | +37.5 |
| Falkirk | 46.5 | 88.7 | 56.8 | 67.5 | +10.2 |
| Fife | 45.0 | 84.1 | 58.6 | 66.7 | +13.6 |
| Glasgow City | 53.5 | 75.0 | 66.6 | 56.2 | +13.1 |
| Highland | 47.1 | 87.0 | 56.0 | 71.6 | +8.9 |
| Inverclyde | 49.9 | 87.4 | 63.8 | 66.0 | +13.9 |
| Midlothian | 43.7 | 86.8 | 62.1 | 68.1 | +18.4 |
| Moray | 42.4 | 85.4 | 50.1 | 67.4 | +7.7 |
| Na h-Eileanan Siar | 46.6 | 86.2 | 55.2 | 70.1 | +8.7 |
| North Ayrshire | 49.0 | 84.4 | 56.9 | 64.6 | +7.9 |
| North Lanarkshire | 51.1 | 84.4 | 61.7 | 60.9 | +10.6 |
| Orkney Islands | 32.8 | 83.7 | 63.2 | 68.3 | +30.4 |
| Perth and Kinross | 39.8 | 86.9 | 61.1 | 73.7 | +21.3 |
| Renfrewshire | 47.2 | 87.3 | 64.8 | 69.2 | +17.6 |
| Scottish Borders | 33.4 | 87.4 | 58.5 | 73.4 | +25.0 |
| Shetland Islands | 36.3 | 84.4 | 56.5 | 70.3 | +20.2 |
| South Ayrshire | 42.1 | 86.1 | 59.0 | 69.8 | +16.8 |
| South Lanarkshire | 45.3 | 85.3 | 63.1 | 65.3 | +17.8 |
| Stirling | 40.2 | 90.1 | 67.7 | 74.0 | +27.5 |
| West Dunbartonshire | 54.0 | 87.9 | 62.0 | 63.9 | +8.0 |
| West Lothian | 44.8 | 86.2 | 58.3 | 67.6 | +13.4 |
| Scotland | 44.7 | 84.6 | 62.0 | 67.2 | +17.3 |
The referendums asked different questions, of slightly different electorates: 16- and 17-year-olds and most EU citizens resident in Scotland could vote in 2014, but not in 2016. Our explainers on why the campaign groups came back after Brexit and on the 2018 dispute over legislative consent follow what happened next.
Method, sources and licence
Data. Counts of Yes and No votes, valid votes and turnout for 2014 come from the results table of the Wikipedia article "2014 Scottish independence referendum" (revision 1380059721 of 13 October 2026); Remain and Leave votes and turnout for 2016 from "Results of the 2016 United Kingdom European Union membership referendum" (revision 1373196891 of 4 September 2026). Both were read on 13 November 2026: 32 council areas, 64 results. Those tables reproduce the official results declared by the counting officers and published by the Electoral Commission (2014 referendum, 2016 referendum).
Checks. The council totals add up to the national figures: 1,617,989 Yes and 2,001,926 No in 2014; 1,661,191 Remain and 1,018,322 Leave in Scotland in 2016. The Scotland turnout figures (84.6% and 67.2%) are the published national ones. Percentages are recomputed from the vote counts and rounded to one decimal, so they can differ by 0.1 point from figures quoted elsewhere. Council names follow the 2016 list (for example "Glasgow City", "Na h-Eileanan Siar").
Licence. Wikipedia text and tables are available under CC BY-SA 4.0; the official results are Crown copyright and may be reused under the Open Government Licence v3.0. This table and chart are shared under CC BY-SA 4.0. Sorting and look-up run in your browser; nothing is sent anywhere.